Financial Performance Metrics Drive The Multiple
For most business owners and investors, the fundamental driver behind being in business (beyond simply providing a valuable product or service) is to make money. The key objective is to leverage capital in the most efficient way possible to deliver the highest returns for the minimum level of effort. Businesses that achieve this objective (or have potential to) tend to transact at higher multiples. The numbers not only tell a storey, but they are a key driver of multiples in business valuations.
This page details the reasons why financial performance is a key driver of multiples and several of the most influential performance metrics.

The Impact of Financial Performance on Multiples
How efficiently a business can utilise its limited resources to extract a return to business owners or investors is a key underlying driver of business valuation multiples.
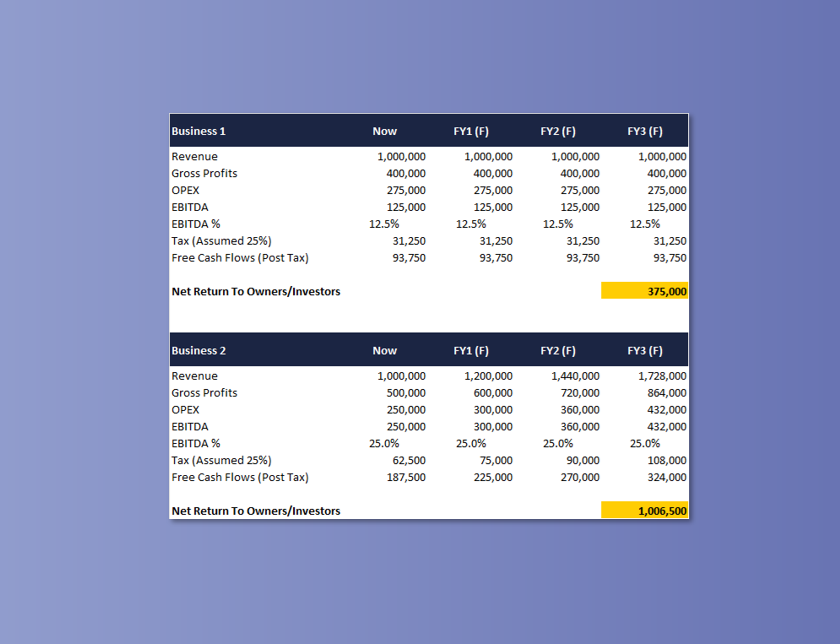
To illustrate, imagine a potential buyer is analysing two similar businesses which are highly comparable in all ways (same target market, same scale, same services etc) except their financial performance metrics differ. The first has stable revenues and generates around 12.5% EBITDA margins (in line with industry benchmarks). The second, has revenues growing at 20% each year and generates 25% EBITDA margins. Assuming these trends continue after the sale/purchase – which business is more attractive and valuable?
Buyers consider the second business more attractive as it will likely provide far greater returns on their capital in a shorter time period. For this reason they may be prepared to pay a higher multiple to acquire the second business.

Scale of Revenues & Revenue Growth Rates
Arguably it is the headline revenue number that buyers, investors or lenders notice first. As a general rule, businesses that operate at greater scale tend to transact at higher multiples. The logic behind this is simple. Businesses that have achieved greater “Scale of Revenues” are typically more robust, have improved systems and processes and are less dependent on founders.
The next thing potential acquirers or professional valuers take note of are “Revenue Growth” trends which are typically reviewed across several recent financial periods to assess the “Compound Annual Growth Rate” (CAGR).
Key considerations include:
-
- Businesses with consistent of accelerating revenue growth rates typically attract higher multiples than those with flatline or negative growth rates.
- Revenue growth indicates demand, scalability and competitive advantage, or on the contrary, declining revenues significantly increases the perceived risk of future trading activities which in turn negatively impacts the assessed multiple.
- Size matters. Scale of revenues is important to multiples particularly in the SME market which tends to operate across distinct bands ($0-$3m, $3m-$10m, $10m-$100m, $100m – $1b, or $1b+)
Gross Margin Percentages
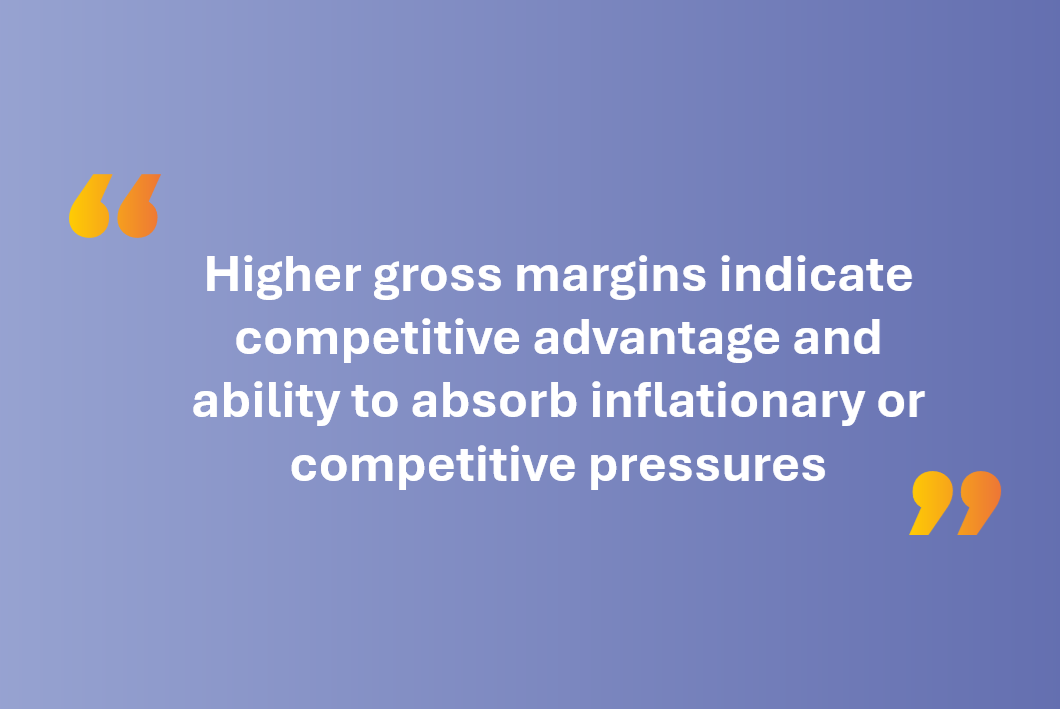
The degree of profitability from fundamental trading activities is a key driver of valuation multiples. Higher gross margins (sales less direct costs expressed as a % of revenues) as compared to industry benchmarks or competitors are a positive indicator of a strong market position and lead to increased levels of earnings. Higher gross margins provide better leverage on trading activities meaning that less production volume is required to generate the same returns.
Key considerations include:
- Above average gross margins (% of revenue) are indicative of sustainable competitive advantage.
- Higher gross margin percentages indicate greater efficiency in converting materials and labour to finished product/services.
- Unexplained margin volatility indicates underlying risk (volume buying, supplier pricing, production efficiencies, wastage, or potential accounting inconsistencies).
Scale of Earnings & Earnings Margin Percentages
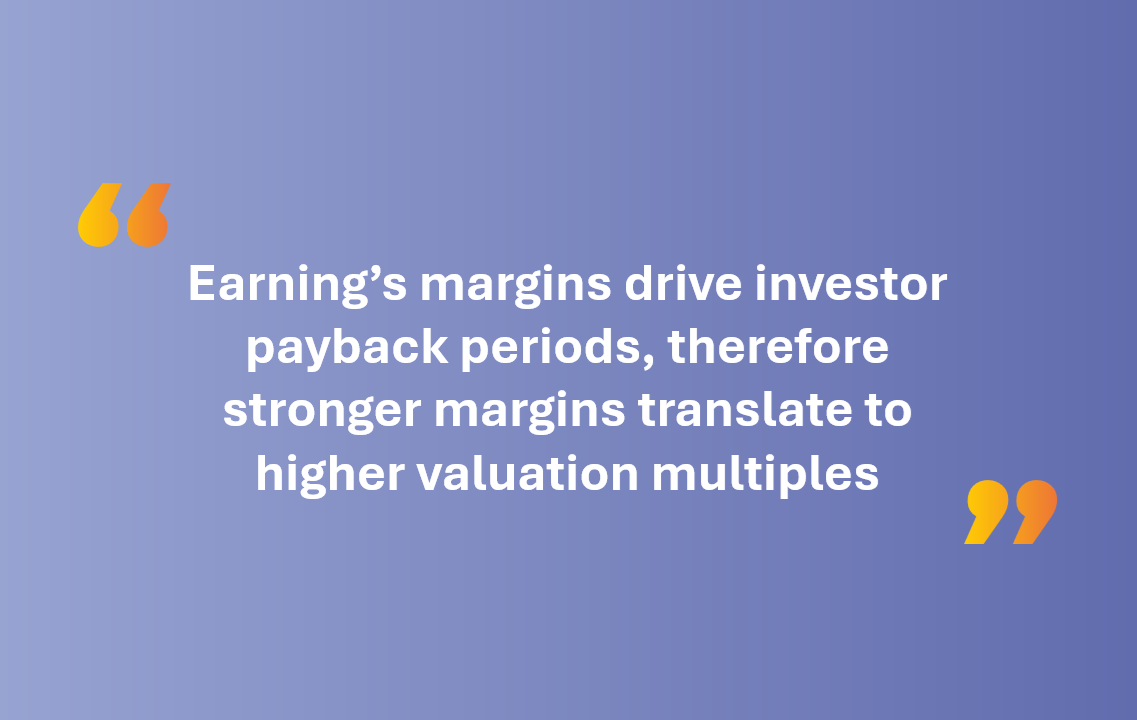
The “Scale of Earnings” (EBITDA, EBIT, NPAT) as well as “Earnings Margin” (eg. EBITDA as a % of revenue) are arguably the most important drivers of multiples and buyer interest. As noted above, businesses generating earnings at scale are far more attractive to buyers and justify higher multiples. Similarly businesses which generate earnings at higher margins enable faster payback of invested capital which translates to higher multiples.
Key considerations include:
-
- Higher margins provide a barrier against negative trading conditions or competitive pressures.
- Higher margins suggest efficient operations and pricing power.
- Higher margins generate stronger cash flows for the same level of effort and a faster payback period.
- Size matters when it comes to earnings. Scale of earnings is important to multiples particularly in the SME market which tends to operate across distinct bands ($0-$1m, $1m-$3m, $3m-$10m, $10m+)
Cash Flow Conversion
How much free cash flow that is generated by a business after payment of income tax and capital expenditure requirements is of critical importance to professional valuers and potential acquirers. Ultimately, it is this “Free Cash Flow” which is available to shareholders in return for the capital invested. For this reason it is an excellent measure of the businesses ability to provide a return on investment. Similarly, the working capital cycle and % of working capital as compared to revenues is also a key topic of interest.
-
- Strong cash flow relative to accounting profit is highly desirable
- Greater working capital balances (as compared to revenue) attract lower multiples as larger amounts of cash are effectively tied up in inventory, receivables, payables rather than in the bank.
- Business models requiring significant CAPEX (as compared to revenues) typically transact for lower multiples primarily due to the ongoing need to maintain / replace expensive plant and equipment in order to continue to generate revenues or scale up.


Capital Efficiency
Businesses which efficiently utilise available resources to generate returns for shareholders are more attractive to potential buyers. This is largely because they provide greater leverage for each dollar invested which in turn enables a business to scale faster with minimal additional capital outlays. Consequently, capital efficiency typically leads to higher multiples.
Key considerations include:
- Low debt increases buyer confidence (optimal debt to equity ratio).
- Low ongoing CAPEX requirements enables more efficient growth.
- Reduced levels of working capital generate increased free cash flows.
Financial Reporting
Numbers utilised in the context of business valuations and / or buyer due diligence can take many forms (bookkeeping, management accounts, financial statements, audited financials, IAS/BAS, CTR’s etc) as well as forward looking numbers (scenario analysis, budgets and forecasts). The overall quality of numbers presented has a direct bearing on perceived levels of risk and therefore the valuation multiple.
Key considerations include:
-
- Accuracy of the Financial Statements including consistent application accounting policies.
- The overall standard/quality of Reported numbers (eg. external Audited Financial Statements rank higher than mgmt. accounts)
- Inconsistent accounting policies, errors, omissions or excessive normalisations increase risk.